Blog · · 16 min read
A floor that cost 50 ms: caching engraved hatching without changing a pixel
A Flutter app that draws its illustrations in code, as engraved lines on a black page, took 40 to 57 ms to build some frames on a Pixel 8, when a 120 Hz screen allows 8.3. The cost wasn’t the moving parts. It was big surfaces that never move, hatched again line by line on every frame. This is how they became cached images, why “no visible change” was the hard part, and the measuring traps on the way.
sink-in.app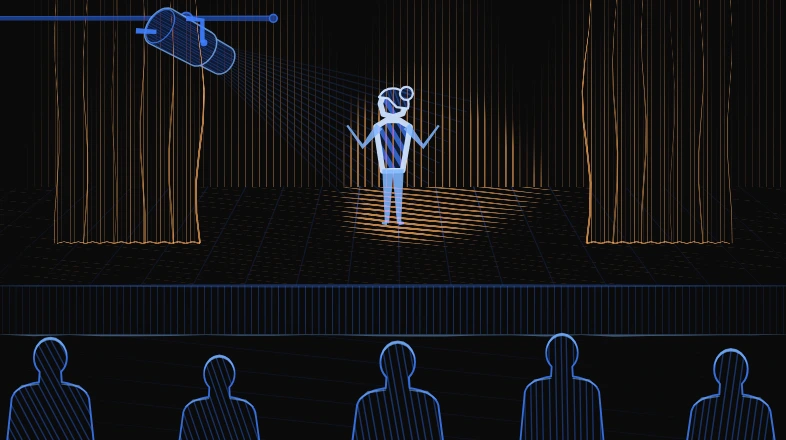
The setup
The app is Sink In, which teaches English phrasal verbs with short animated scenes. Each scene is a CustomPainter that repaints every frame, because something in it moves: a balance tips, a hammer swings, a performer walks on. Every surface is shaded the way an engraver would shade it, with parallel lines that get wider and paler where the light falls.
That shading is generated, not drawn by hand. For each surface:
- Lay parallel lines across the shape’s bounding box, clipped to the shape.
- Sample each line at up to 29 points. At every point, evaluate the scene’s lighting.
- Set the line’s width at each point from the light, and its colour with one gradient stop per point.
- Draw it as a tapered path with a linear gradient shader.
The lines also jitter slightly in six steps per loop, like a hand-drawn animation. A floor is a few hundred of these lines. Nothing about them changes between those six steps, but they were rebuilt from scratch on every frame.
The task was to find the frame drops and fix the ones that could be fixed with no visible change. The work was done with Claude Code, an AI coding agent, with me deciding and judging. It wasn’t the first round. Two earlier ones, in September and October, built the image cache this post relies on and found most of the other traps below, so this post covers all three.
- Slowest scene before
- 57 ms
- Same scene after
- 11.5 ms
- Frame budget at 120 Hz
- 8.3 ms
- Lines moved
- 0
Measuring on a real phone
The first numbers were wrong in three different ways, and each one looked like a real problem.
- The Dart VM timeline invents long frames. It is a ring buffer that holds a few seconds. Read it after a longer run and events lose their start or end, so frames look seconds long. For frame times, use a Perfetto system trace instead, with the app started with
--ez trace-systrace trueso Flutter’s events go into it. In recent Flutter versions on Android, the UI work runs on the platform’s main thread, so look there, not for a thread called1.ui. - Profiling creates jank. Pulling CPU samples through the VM service during a trace produced 1.4 to 2 second “freezes”. The request is handled on the UI isolate, so the measurement caused the freeze. Take frame times and CPU profiles in separate runs.
- The phone drifts. The same scene on two builds an hour apart measured 25 and 41 ms. The phone heats up and slows down. Big wins survive that. To judge a small change, compare it in one run: switch it on and off every 0.7 seconds and mark each switch in the trace.
Earlier rounds added a few more. An in-app logger built on FrameTiming (switched on with a --dart-define) is the simplest frame counter, and on Android 16 it’s also the only easy one: dumpsys SurfaceFlinger --latency returns no rows there. A raster time stuck at exactly 16.6 ms on a 60 Hz phone is most likely the frame waiting for the display, not GPU work. And a scene drawn by a fragment shader looked cheap on the desktop because the tests ran without the shader; on the phone it ran at 29 fps.
Two more things helped. Any accessibility service turns on Flutter’s semantics tree, and that added 10 to 60 ms to some frames on the test phone. It’s real cost for those users, but it isn’t painting, so it has to be told apart. And a test that paints every scene on the desktop and times it gave a ranking in a minute. Desktop times multiplied by about four came close to the Pixel’s, so the phone was only needed to confirm. An earlier sweep of all 604 painters on a OnePlus 6 gave a similar rule: the phone was about 4.5 times slower to record a frame and 3 times slower to rasterize it.
Where the time went
The CPU profile of the balance scene, in milliseconds of CPU per second of animation:
  421 ms/s  the scene's paint()
  383 ms/s  hatch lines, all surfaces
  307 ms/s  the counter's surfaces alone
   98 ms/s  lighting samples inside the hatching
Almost all of it is hatching, and most of that is the counter the balance stands on. Everything that moves shares what’s left. The other slow scenes looked the same: a stage floor, the ground under some pegs, a floor under metronomes.
Counting draw calls would not have found this. The balance draws 471 paths a frame, and the counter is only 48 of them. But those 48 lines are long, cross the lamp’s pool of light and carry the most light samples, and they cost about two thirds of the frame. The profile shows that; a draw call count doesn’t.
Why not a RepaintBoundary?
The usual Flutter advice for a still background behind animation is to split it out: paint the static part in its own CustomPaint under a RepaintBoundary, so it is recorded once and Flutter reuses its layer. That is the first thing to try, and it’s often enough. It didn’t fit here, for three reasons:
- Static and moving parts interleave. The stage front is drawn over the performer, and the audience in front of the stage. The still parts aren’t one layer at the back.
- Moving things change the still surfaces. Shadows are erased out of the floor’s hatching, so the floor under a moving object is different every frame.
- Still isn’t always still. In some scenes the light swings for part of the loop, and every surface it touches changes while it does.
So the caching went inside the painter instead: each surface is drawn once into an image, the image is drawn at the surface’s place in the paint order, and shadows are cut out of it live on top. When the surface’s look changes, it is drawn live until it settles again.
Draw it once, as an image
The cache was first built in October for the app’s tunnel scenes, which are thousands of engraved stones. An obvious version would keep the recorded Picture and replay it. With Impeller that only saves the UI thread: Impeller has no raster cache, so a replayed picture has its paths tessellated again every frame. Rasterizing once and drawing an image saves both threads. On a OnePlus 6 the tunnel went from 26 to 59–60 fps; its raster time fell from 38 to 16.6 ms and its UI time from 17.5 to 4.5 ms.
The core is short. Record the surface into a Picture, turn it into an image with toImageSync at the screen’s real pixel size, and draw that image back with one image pixel per screen pixel, so nothing is resampled:
void paintCached(Canvas canvas, Object look, Rect area,
    void Function(Canvas) draw) {
  // Where the canvas lands on screen. A painter's transform is in
  // logical pixels; the device pixel ratio is applied above it.
  final m = canvas.getTransform();
  final dpr = view.devicePixelRatio;
  final sx = m[0] * dpr, sy = m[5] * dpr;
  final tx = m[12] * dpr, ty = m[13] * dpr;

  // The screen pixels the surface covers, in whole pixels.
  final ox = (tx + area.left * sx).floorToDouble();
  final oy = (ty + area.top * sy).floorToDouble();
  final w = (tx + area.right * sx).ceil() - ox.toInt();
  final h = (ty + area.bottom * sy).ceil() - oy.toInt();

  // The fraction of a pixel is part of the key (see below).
  final key = (look, w, h, sx, sy, tx - ox, ty - oy);
  final image = _cache[key] ??= () {
    final recorder = ui.PictureRecorder();
    draw(Canvas(recorder)
      ..translate(tx - ox, ty - oy)
      ..scale(sx, sy));
    final picture = recorder.endRecording();
    final image = picture.toImageSync(w, h);
    picture.dispose();
    return image;
  }();

  canvas.drawImageRect(
    image,
    Rect.fromLTWH(0, 0, w.toDouble(), h.toDouble()),
    Rect.fromLTWH((ox - tx) / sx, (oy - ty) / sy, w / sx, h / sy),
    Paint()..filterQuality = FilterQuality.none,
  );
}
look is everything the surface’s pixels depend on: the light’s position and strength, opacity, the canvas size, the jitter step. Leave anything out and a stale image shows up. Six jitter steps means at most six images per surface. The real version also skips the cache for rotated or skewed canvases, keeps a 24 MB budget with least-recently-used eviction, drops images that haven’t been drawn for 15 seconds, and clears everything when the system reports memory pressure (didHaveMemoryPressure). Both numbers came from mistakes. A full-width image is about 2.4 MB, and the tunnel first combined an 8-step outline jitter with a 6-step hatch jitter: 24 looks, 57 MB. Putting both on the same 8 steps brought it to about 20. The first idle limit was 5 seconds, but each step comes round again about 5.3 seconds later, so every image was thrown away just before it was needed.
The image helps both threads. The UI thread skips building hundreds of paths and sampling the light, and the raster thread draws one image instead of hundreds of anti-aliased gradient paths.
Making the image match live drawing
The first versions were fast and almost right. “Almost” wasn’t the brief, and four separate problems stood between almost and exact. They apply to any cache of this kind.
- Include the device pixel ratio. Inside
paint,canvas.getTransform()is in logical pixels; the ratio is applied by a layer above the painter. The first version of the cache forgot this and rendered at 1/2.625 of the Pixel’s resolution, which looked blocky. The tests missed it because they scaled the canvas by hand, so the ratio was inside the transform there. The test now sets the ratio the way the app does and fails on the old code. - Keep the fraction of a pixel. A common shortcut is to snap the image to whole pixels, so a card scrolling in a list can reuse one image. That is worth a lot: when the scrolling cards were snapped, the card list went from 23 to about 40 fps and its GPU time from 32–37 to 19–21 ms. But it puts the art up to half a pixel away from where live drawing puts it: invisible on a moving card, a visible shimmer on a still one. For still surfaces, keep the fractional offset in the key and draw live while the canvas moves.
- Cache only what repeats. At the end of each loop some scenes crossfade between two moments, painting every surface twice per frame with two different looks. A cache that stores every new look makes a new image on every frame of that crossfade. The fix: cache a look only after it has been asked for twice in a row. That rule has a price, and it has gone back and forth. The October version used it everywhere and paid two heavy frames per new jitter step, one live and one to save the image; dropping it took the tunnel’s first loop from 49 to 55 fps. Still surfaces now use it again, because they’re the ones that crossfade.
- Stay inside
saveLayerbounds. When a painter draws into asaveLayerwith bounds, an image that crosses the bounds edge is blended differently from lines drawn live, and the edge rows came out a few levels brighter. Clip the cached area to the layer’s bounds, the same way live drawing is clipped. - Fade the strokes, not the image. Drawing a cached image at half opacity isn’t the same as drawing each stroke at half opacity: where strokes overlap, live drawing adds them up and the image doesn’t. A sky scene that faded whole cached clouds let the sun show through more than before. The images are now baked at full strength and faded per stroke where it shows.
- Don’t change the shape. This one needs its own section.
Cutting a shape moves every line
Some floors were much bigger than their canvas and ran down the page below the scene. The image would have been too big to cache, and the drawing spilled where it shouldn’t. The obvious fix is to cut the shape to the canvas with Path.combine, and the first round did exactly that.
It looked fine, but it wasn’t. The hatching lays its lines out from the middle of the shape’s bounding box:
final bounds = shape.getBounds();
for (var i = -lines; i <= lines; i++) {
  final mid = bounds.center + normal * (i * spacing);
  // ... one line through mid
}
Cut the shape and its bounding box shrinks, the centre moves, and every line moves with it, by up to half the line spacing. Any generated pattern laid out from a shape’s bounds behaves the same way.
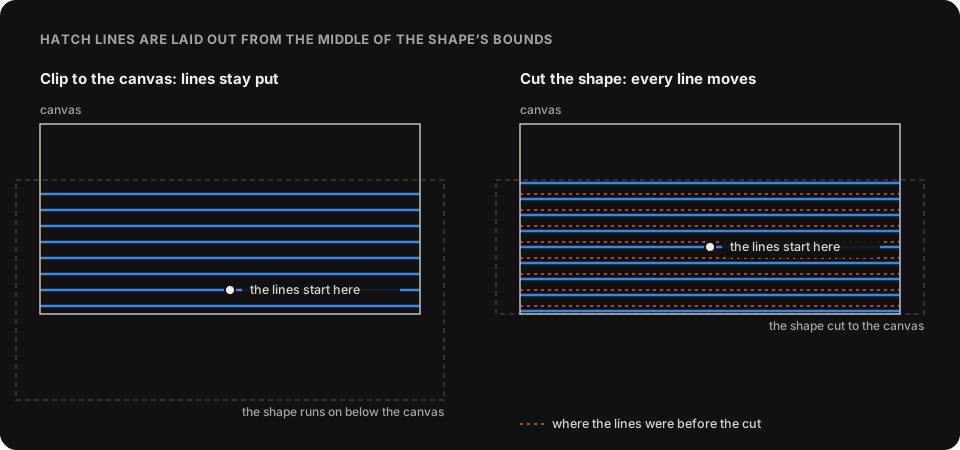
The tests didn’t catch it, because they compared the cached drawing with the live drawing of the same new code, and both had the moved lines. Only comparing the new code with the old code shows it. The fix is to keep the shape whole and clip the canvas instead:
// Moves every line: a new shape, new bounds, a new layout.
final cut = Path.combine(PathOperation.intersect, ground,
    Path()..addRect(frame));
paintSurface(canvas, cut);

// Keeps them: the same layout, with part of it hidden.
canvas.save();
canvas.clipRect(frame);
paintSurface(canvas, ground);
canvas.restore();
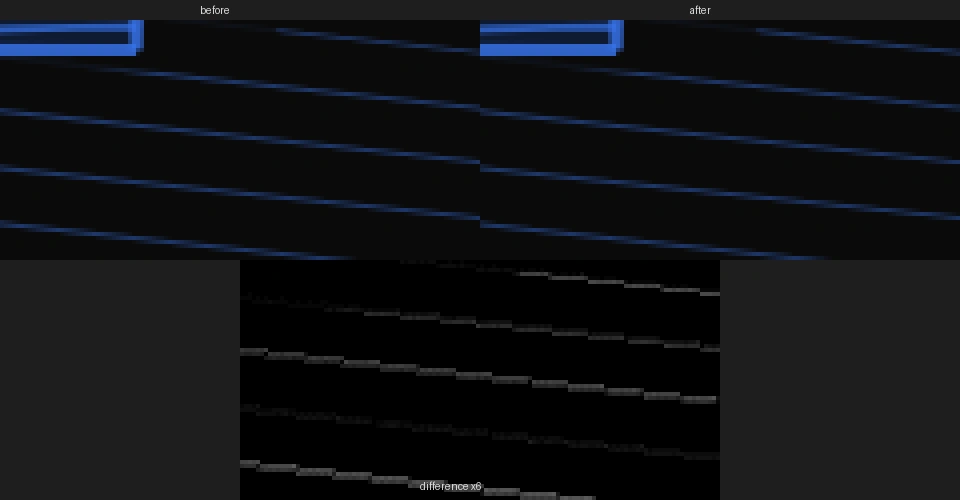
One effect remains. Any clip changes the anti-aliasing of a few edge pixels slightly, up to 34 levels out of 255 in the test renderer. That is a softer or sharper pixel at the end of a line, not a moved line:
Testing that nothing changed
Two checks, answering different questions:
- Cached against live, in the test suite. Each scene is painted live and from the cache at eight points in its loop, at the Pixel’s 2.625 device pixel ratio, rendered with
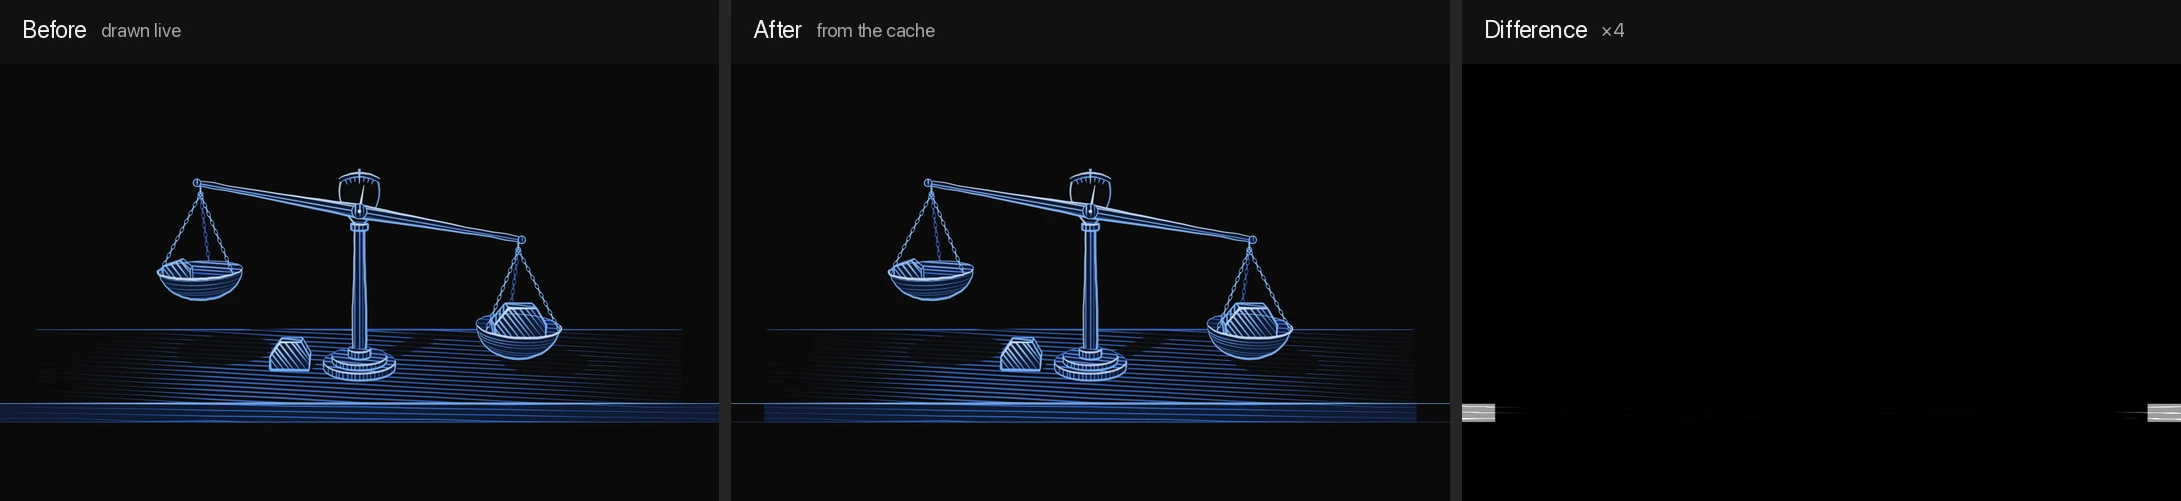
Picture.toImageand compared pixel by pixel. Inside the canvas no channel may differ by more than 4 out of 255. This catches the half pixel, the crossfade and the layer edge, and keeps catching them as the scenes change. - New against old, once per change. The scene from the code before the change and after it, side by side with a difference image. This is the check that caught the cut.
Results
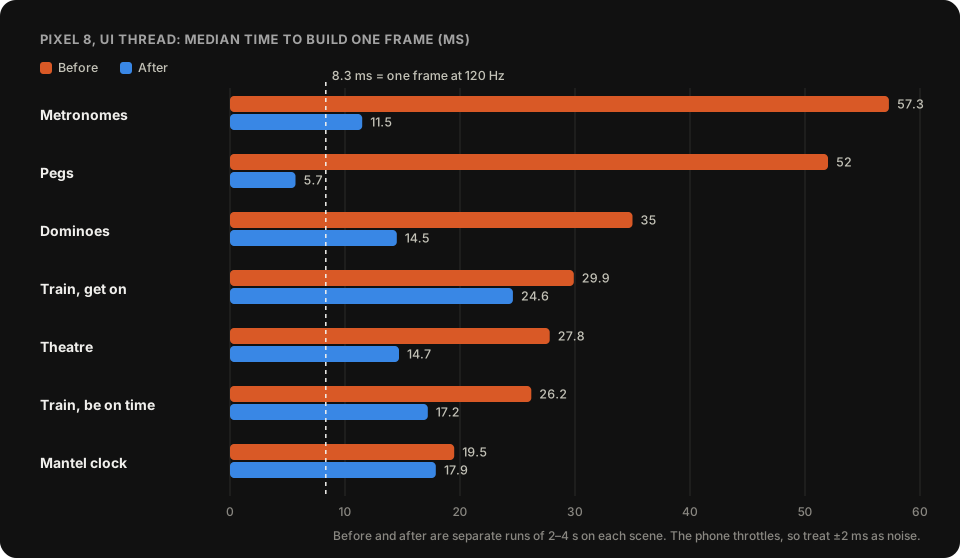
| Scene | Before, ms | After, ms |
|---|---|---|
| Metronomes | 57.3 | 11.5 |
| Pegs | 52 | 5.7 |
| Balance | 40.2 | not measured on the phone yet (Mac: 10.3 → 3.6) |
| Dominoes | 35 | 14.5 |
| Train, boarding | 29.9 | 24.6 |
| Theatre | 27.8 | 14.7 |
| Train, on time | 26.2 | 17.2 |
| Mantel clock | 19.5 | 13.6 and 17.9 (two runs) |
The raster thread got faster too. The metronome scene went from 23 to about 11 ms a frame there, and the dominoes from 19 to about 11.5. The balance scene was changed last, when the phone was out of storage for another install, so it only has desktop numbers so far: 10.3 to 3.6 ms, about the same ratio as the others.
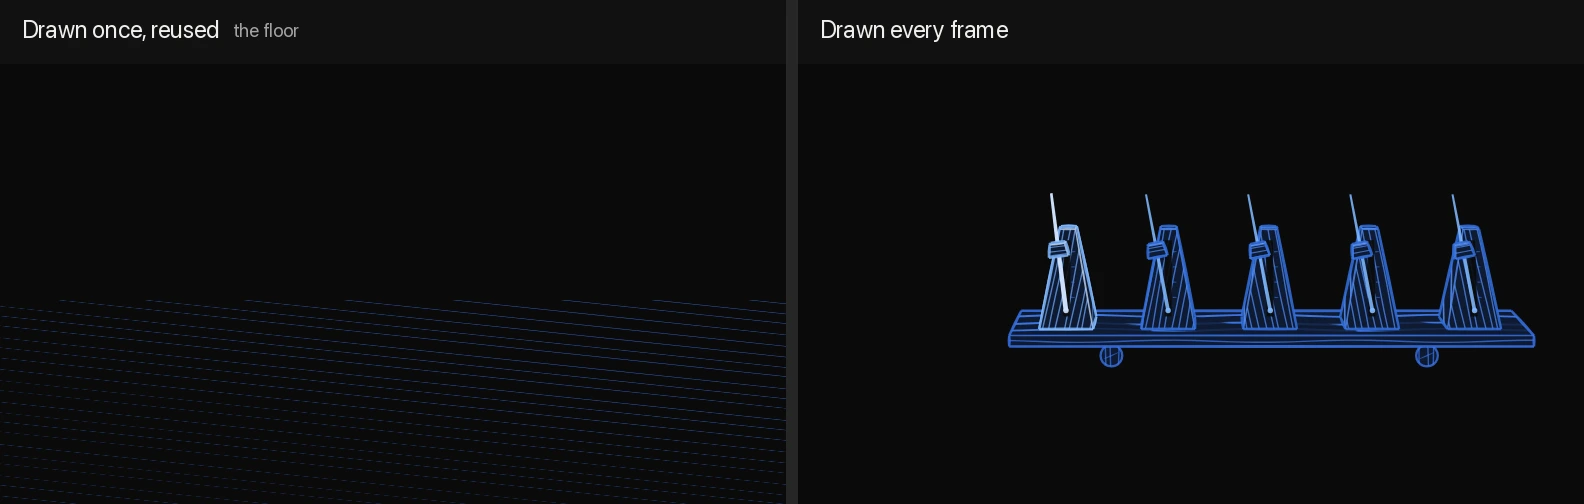
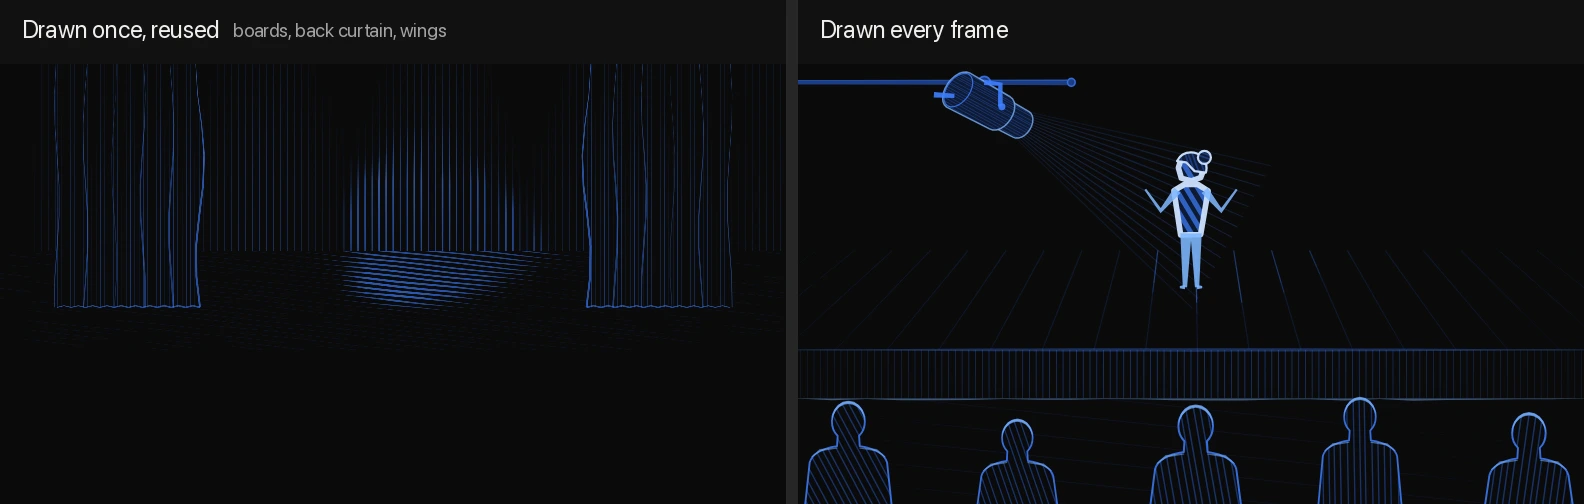
Paths per frame, before and after, for the scenes in the pictures:
| Scene | Paths, live | Paths, cached | What became an image |
|---|---|---|---|
| Theatre | 1,300 | 886 | boards, back curtain, wings |
| Metronomes | 792 | 401 | the floor |
| Pegs | 674 | 339 | the ground |
| Dominoes | 637 | 442 | the floor |
| Balance | 471 | 423 | the counter top and front |
Only the pegs scene is under budget now. Most scenes went from three to six frame budgets down to one and a half or two. That’s the difference between a stutter you see and one you mostly don’t, but it isn’t 120 fps yet.
What’s still drawn every frame
The pictures above raise an obvious question: plenty of what’s still drawn live doesn’t move either. To measure it, each scene was played through its whole loop with its cache on. Every draw call was timed, and every pixel was checked for whether it ever goes dark, which shows what moves and what doesn’t.
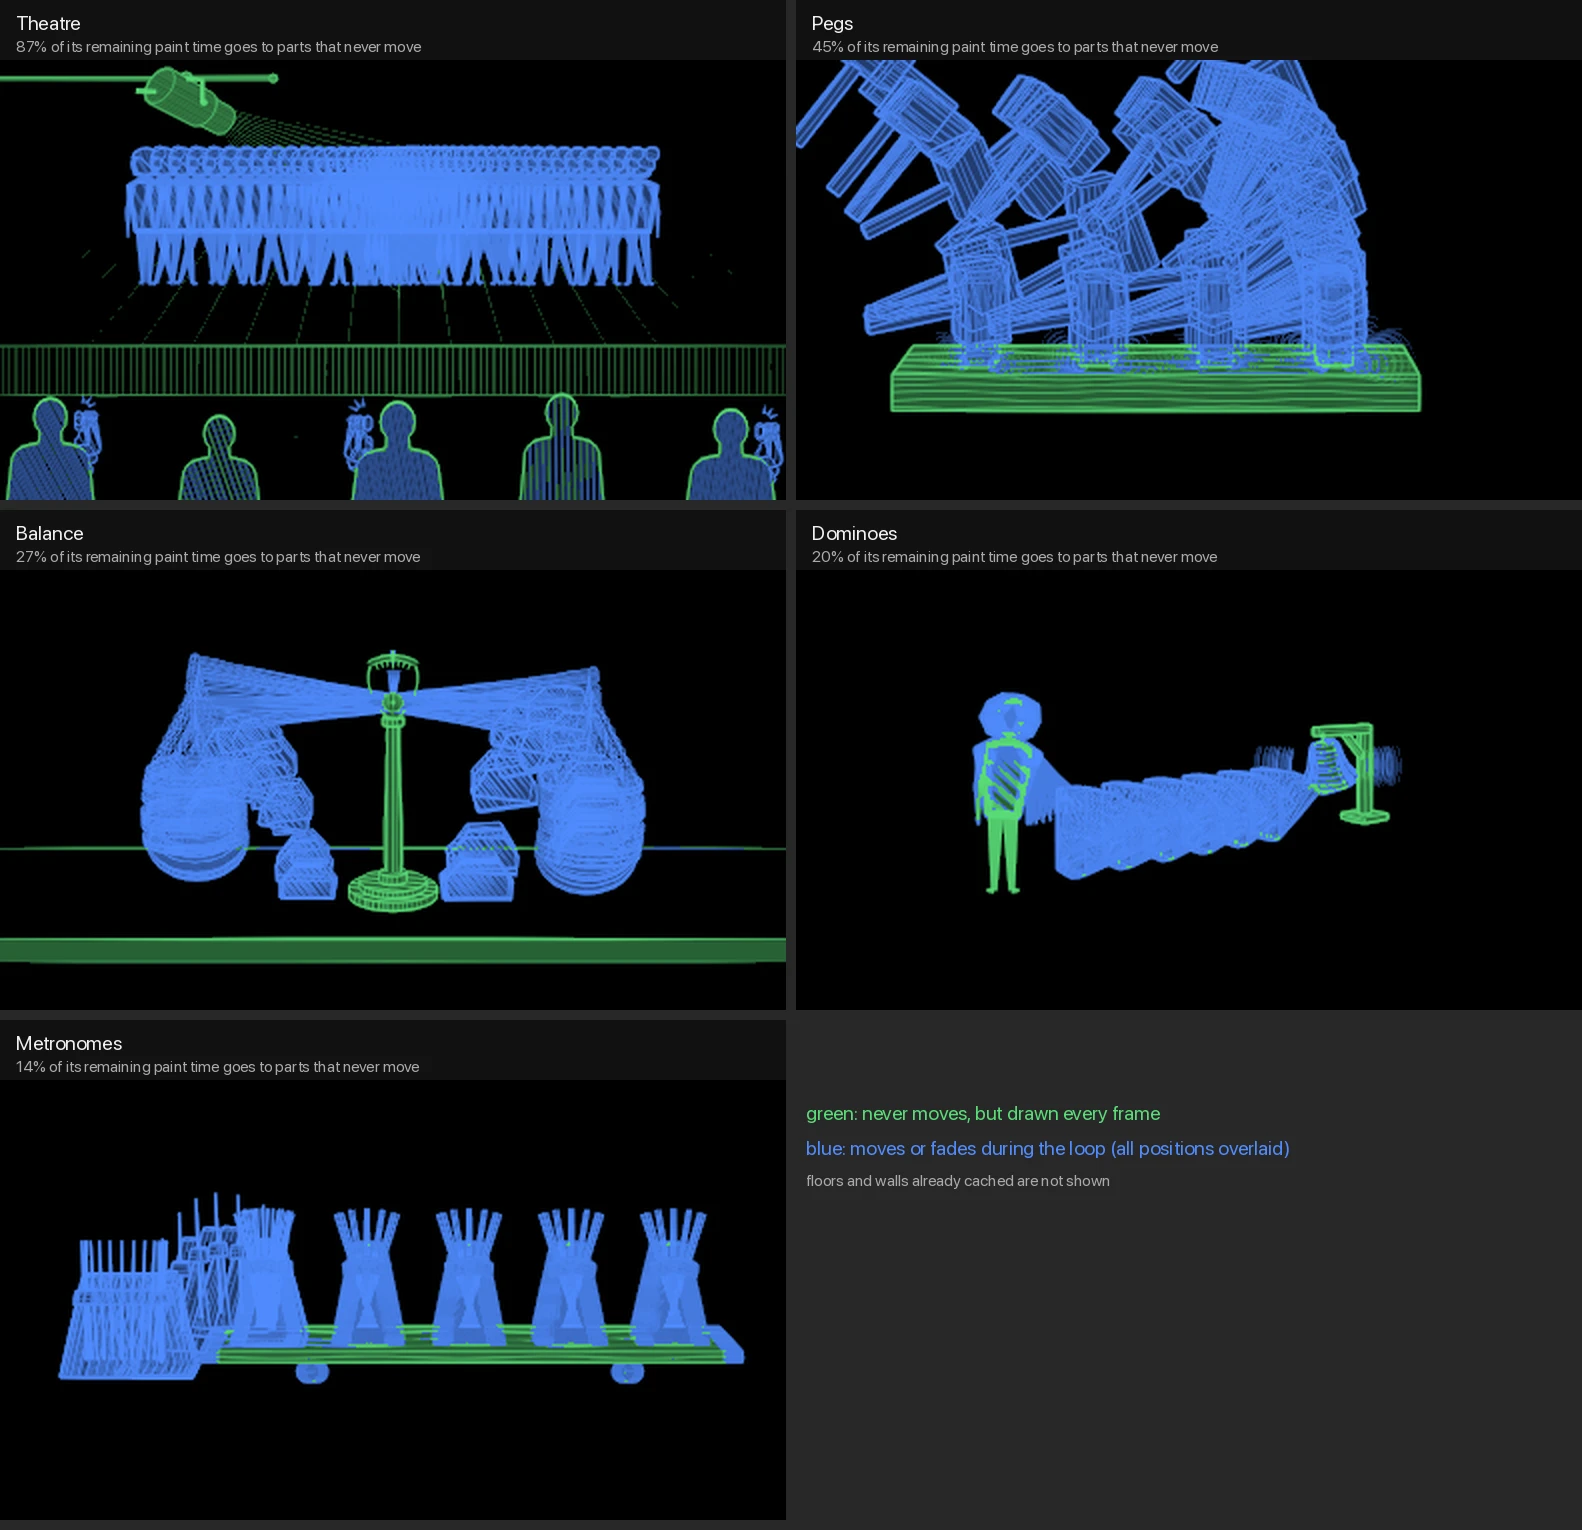
| Scene | Remaining paint time on still parts | Which parts |
|---|---|---|
| Theatre | 87% | audience, stage front, spotlight rig and beam, board seams |
| Pegs | 45% | the wooden board |
| Balance | 27% | column and base, counter edges |
| Dominoes | 20% | the person, the bell stand |
| Metronomes | 14% | the board |
In the theatre almost everything left is still, worth an estimated 5 ms of its 14.7 on the phone. The balance and the pegs have about 3 ms each to gain, and the dominoes and metronomes about 1 ms, because what they spend now goes mostly into moving parts. These are the next candidates, with the same rules: the audience lifts phones at moments in the loop, so its key needs that state; the beam and the seams depend on the spotlight; and each still group is cached at its own place in the paint order.
Some things the cache can’t help with:
- Light that keeps changing. In the bedroom scenes the light crosses the room for the whole loop, so walls and floor look different on every frame. The cache sees that and keeps drawing live, which costs nothing and saves nothing. Caching a few light levels, or drawing the light over unlit hatching, would both work, but neither is pixel-identical. That makes it a design decision.
- Expensive moving parts, such as a rowing boat or a fence being built.
- Work outside the scenes. One screen draws about a thousand
MaskFilter.blurglows a frame; one tap rebuilds tabs that aren’t on screen; one list spends 90 to 116 ms on its first layout. Each needs its own fix.
Offscreen passes you don’t see
Some of the biggest wins in the earlier rounds weren’t in the painters at all. Opacity, ColorFiltered, ShaderMask, BackdropFilter and saveLayer all make Impeller render into an offscreen texture and composite it back. One is cheap. One per list item per frame isn’t.
- Count the passes. A render-pass audit with impeeler, which counts passes inside widget tests, found 16 per frame on every home tab, and 36 on a tab of animated cards. The glass navigation bar’s
BackdropFilteralone put the whole frame offscreen for 5 or 6 of them. That one stayed: it is the design. - Tint, don’t filter. The bar’s icons were tinted with
ColorFilteredand dimmed withAnimatedOpacity. Tinting them throughIconThemeand folding the dimming into the colour’s alpha took every tab from 16 to 9 passes. - Fold opacity into the paint. Each animated card was wrapped in
Opacity: an extra pass per card, every frame. Passing the opacity into the painter as a multiplier on every stroke’s alpha took the tab from 46 to 54–55 fps on the OnePlus.
The catch is the same as with cached images: group opacity and per-stroke opacity differ where strokes overlap. On the navigation icons that came to at most 18 levels out of 255 where a cap’s strokes cross; on the cards, under half a level on average. Both were checked before they shipped.
SnapshotWidget looked like the answer for scrolling cards, and partly was. With the scenes’ heavier effects off, snapshotting still cards cut dropped frames from 10–19% to 0–1%. With the effects on, taking the snapshots at the start of each drag cost about as much as it saved and made the worst frame longer, so those cards draw live.
Work nobody sees
The September round had one rule, “nothing changes visually”, and no profiler. It counted instead: 135 CustomPainters, 27 repeating animations, 53 Opacity widgets. Most textbook wins were already in place. The real one was a surprise:
- Hidden tabs keep ticking. Everyone knows an
IndexedStackkeeps its tabs alive. Fewer know that alive means ticking. About a dozen animated scenes on a hidden tab kept theirAnimationControllers running at up to 120 Hz. Painting was skipped, but build and ticker work weren’t, so the phone never went idle. Wrapping each tab inTickerMode(enabled: index == selected)stops them, the same wayNavigatordoes for routes under an opaque page. - Muting a ticker has a trap. When a muted controller resumes, the whole hidden interval arrives as one long frame. Code that integrates time by hand, such as an eased speed ramp, jumps ahead. The scenes now freeze when
TickerModeturns off and resume cleanly when it turns back on. - Transparent routes keep the page below alive. A page route with
opaque: falsekeeps the screen underneath building and painting. That one is still open.
Other hot spots from earlier rounds
- Fragment shaders that recompute per pixel. The scene that ran at 29 fps spent about 34 ms a frame on the GPU, recomputing about 190 trail points with
sinandcosfor every pixel. Computing each value once gave identical frames at 59 fps. - Path operations in
paint.Path.containstook 24% of the CPU in a sky scene; an analytic inside-test replaced it. On the Pixel 8,Path.combinetook 26% of the UI thread in one card that unions shapes every frame. - Moving things can be images too. Clouds that only drift were cached and slid as images, redrawing at most two per frame as they change shape. The sky went from 19–26 to 59–60 fps, and a 20-second screen recording from 582 frames to 1,170.
- Blur is a pass. On Impeller each
MaskFilter.blurpaint is its own Gaussian pass. One painter file had 184 of them in September, some created inside loops. Static glows can be cached like the surfaces above; one screen still draws about a thousand a frame. - A bigger
cacheExtentdoesn’t help painting. Children in the cache extent are built and laid out, not painted, so their first paint still lands on the frame they scroll in. - Precomputing can cause the hitch. Baking a dog’s ear and tail physics into a loop table on first paint took 124–215 ms in tests: smooth afterwards, one long frame on first show.
Takeaways
- Profile, don’t count. A few dozen long lines cost more than hundreds of short ones.
- Look for big things that don’t move. The faintest surface on screen was the most expensive one.
- Cache images, not pictures, on Impeller. A replayed picture is tessellated again.
- Try a RepaintBoundary first. Cache inside the painter when static and moving parts interleave, or when moving parts change the static ones.
- Put the whole look in the key, including the fraction of a pixel, and only cache a look that repeats.
- Clip, don’t cut. Changing a shape changes how a generated pattern is laid out, even where the shape still shows.
- Test the cache against live, and the change against the old code. The first keeps the cache honest; only the second shows that the change itself moved something.
- Count offscreen passes and idle tickers. An
Opacityper card or a hidden tab that keeps animating costs frames without showing up in any painter. - Distrust your first measurements. A ring buffer, a profiler and a warm phone each produced a convincing problem that wasn’t there.
Sink In is on iPhone, Android and Mac at sink-in.app. Questions or corrections are welcome at hello@pomisoft.dev.